Preamble
I wrote this editorial some years ago in response to the deluge of reports that reappraise prior studies with the fragility index and the subsequent permeation of this method into the medical community. Sadly, I could not get the article picked up by a medical journal (most suggested a methods journal instead, where this information is already known), and so I am posting it here. I hope this is of use to medical community who currently use the fragility index.
Introduction
In 2014, the fragility index was proposed to evaluate the strength of evidence provided by a randomised controlled trial (RCT) (1). The method entails hypothetically moving patients, one at a time, within the intervention arm of an RCT from “survival” to “death” (figure 1). For each patient move, the p value for the primary outcome is recalculated using Fisher’s exact test (2). The number of patients moved in order to render the p value greater than 0.05 is the fragility index.
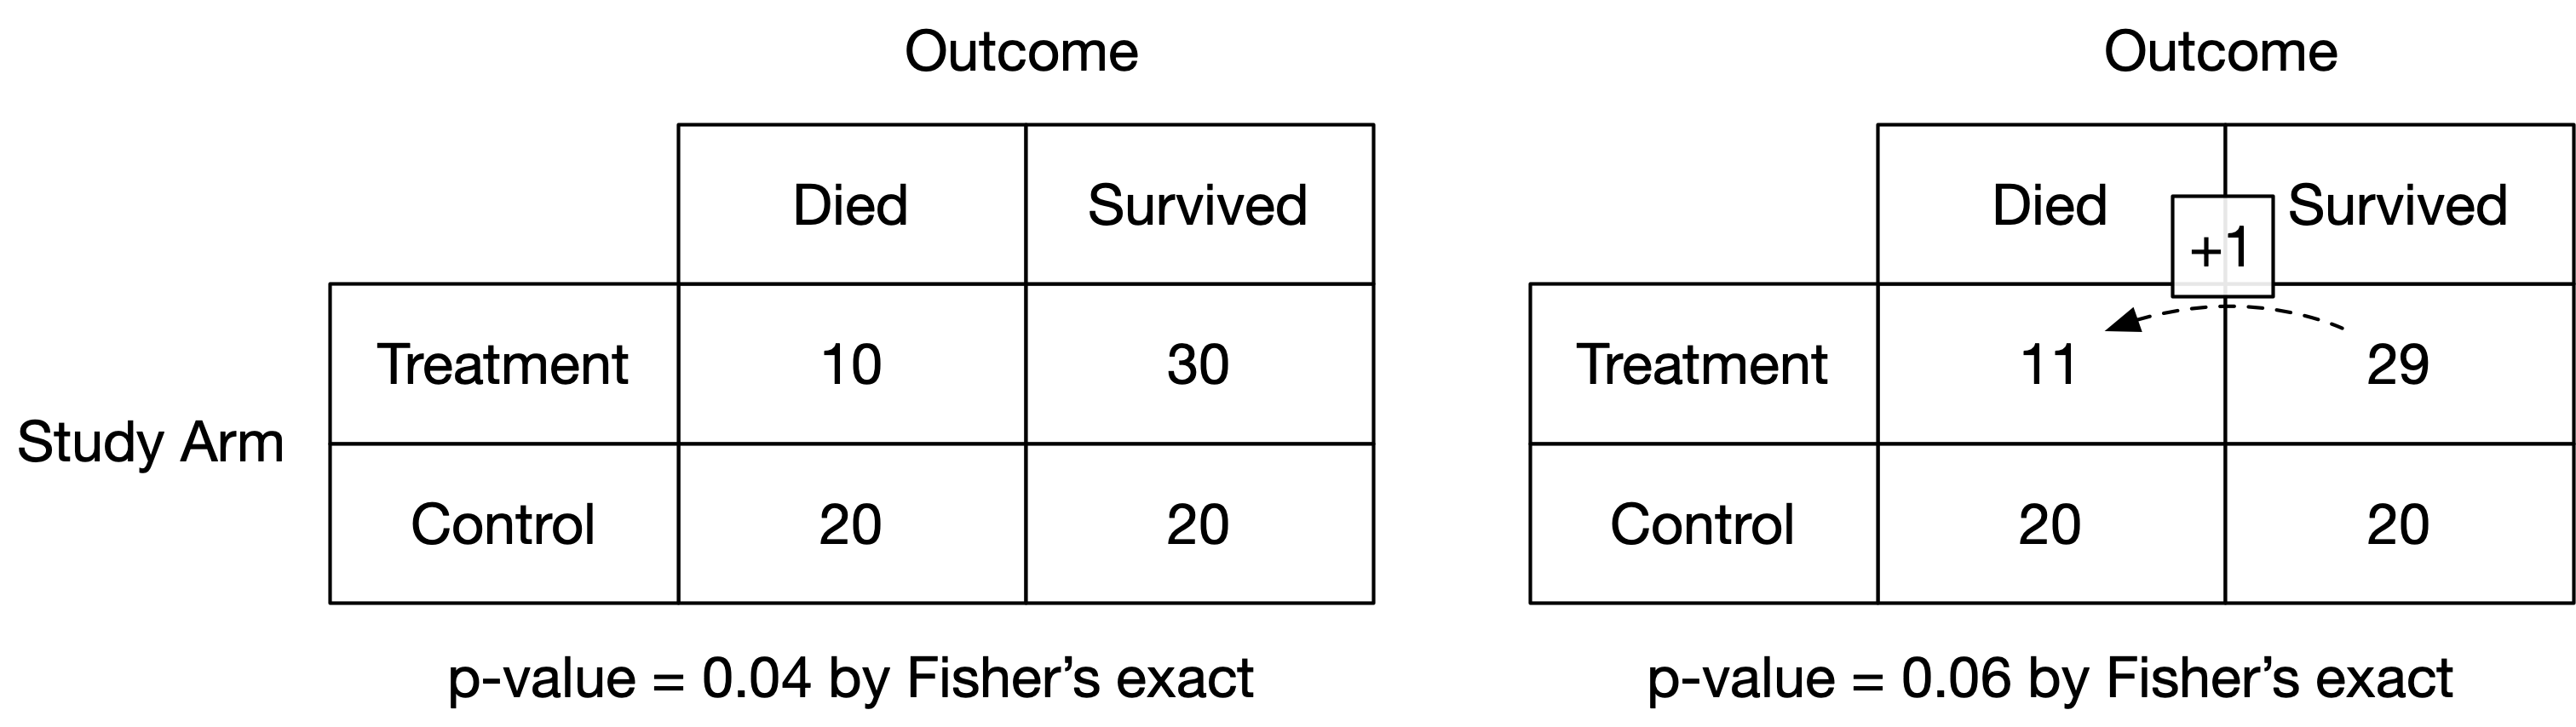
Figure 1: Illustration of the calculation of the fragility index
The originators of the fragility index applied it to nearly 400 high profile RCTs. They contended that a large number of these RCTs were “fragile” in that a small number of patients experiencing a different outcome would change the conclusions of the study (1). Many RCTs have now been evaluated with the fragility index; including studies in critical care; peri-operative medicine; surgery; anaesthetics; urology; ophthalmology; cardiology and nephrology (3–13). Most RCTs, including those considered to be of a robust nature, have now been labelled as “fragile” by this approach.
The fragility index certainly has superficial appeal as it feels intuitive. However, I will demonstrate empirically with “in-silico” simulation that it is a simple transformation of the study’s p value. Thus, the fragility index cannot comment upon the validity of an RCT as no new information has been learnt. The fragility index beguiles the reader into mistrusting the results of an otherwise well conducted study. In this instance, we should ignore intuition, and instead rely upon the rigorous statistical frameworks that already have a rich history of reliably discriminating signal from noise.
RCTs are powered a priori to detect a minimum clinically important difference (MCID); the smallest effect size that would be clinically meaningful. This power calculation specifies the minimum number of patients to be recruited so that if a true effect exists (greater than or equal to the MCID), it will produce a “significant” result with a p value below the alpha boundary (typically set at 0.05) at a known frequency (typically 80-90%). Over-recruitment exposes more patients to potential harm and requires more resources and time.
The p value is a hypothetical frequency probability in that its properties are guaranteed in the long run over an infinite number of imagined future trials. In practice, only a single RCT can be performed, and a single p value observed. I performed computer simulations of parallel arm RCTs to observe the long running behaviour of the p value and fragility index. Nine scenarios were examined: a true absolute risk reduction (ARR) in mortality of 15%, 10% and 5%, each powered at 70%, 80% and 90%. Control group mortality was fixed at 30%. The numbers of patients required for each combination of ARR and power ranged from 190 (15% ARR at 70% power) to 3,346 (5% ARR at 90% power). Each scenario was simulated 1,000 times. Simulations were conducted in R (14) with code published in the public domain (15).
Figure 2 shows the distribution of the fragility index for each scenario. For a given effect size, the fragility index increases as the study power (and hence sample size) is increased. Likewise, for a given power, the fragility index increases as the effect size decreases (and hence sample size increases). Crucially, all the simulations are equally valid since the underlying data generating mechanism has been controlled. The fragility index is thus an expression of the study characteristics, and not of validity.
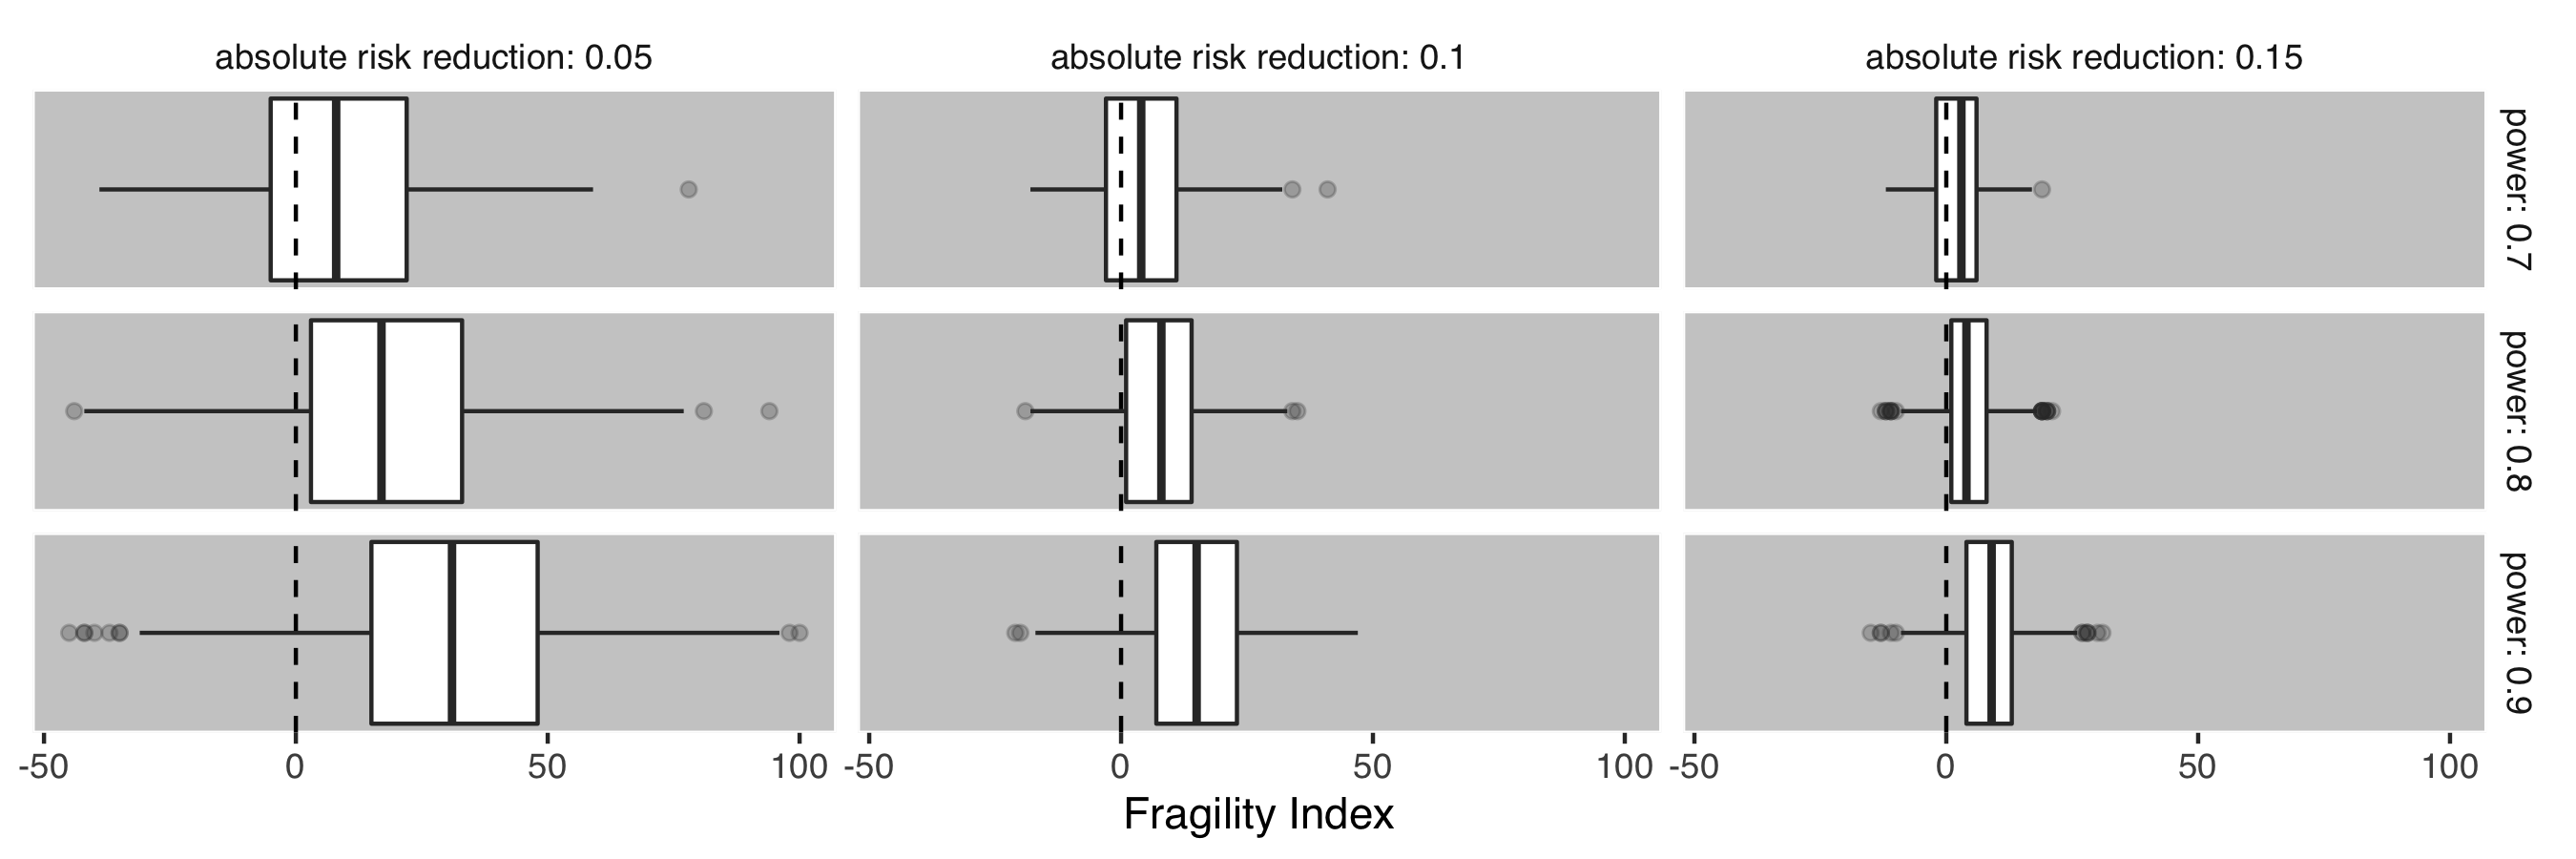
Figure 2: Box and Whisker plots demonstrating the distribution of fragility index over a range of possible study scenarios. Each facet details 1000 realisations of the simulation. Levels of absolute risk reduction and power are organised by column and row respectively.
Figure 3 shows the clear relationship between the fragility index and the p value. The fragility index can be regarded as a transformation of the p value, with the shape of the relationship determined by the number of participants, the observed treatment effect and control group mortality.
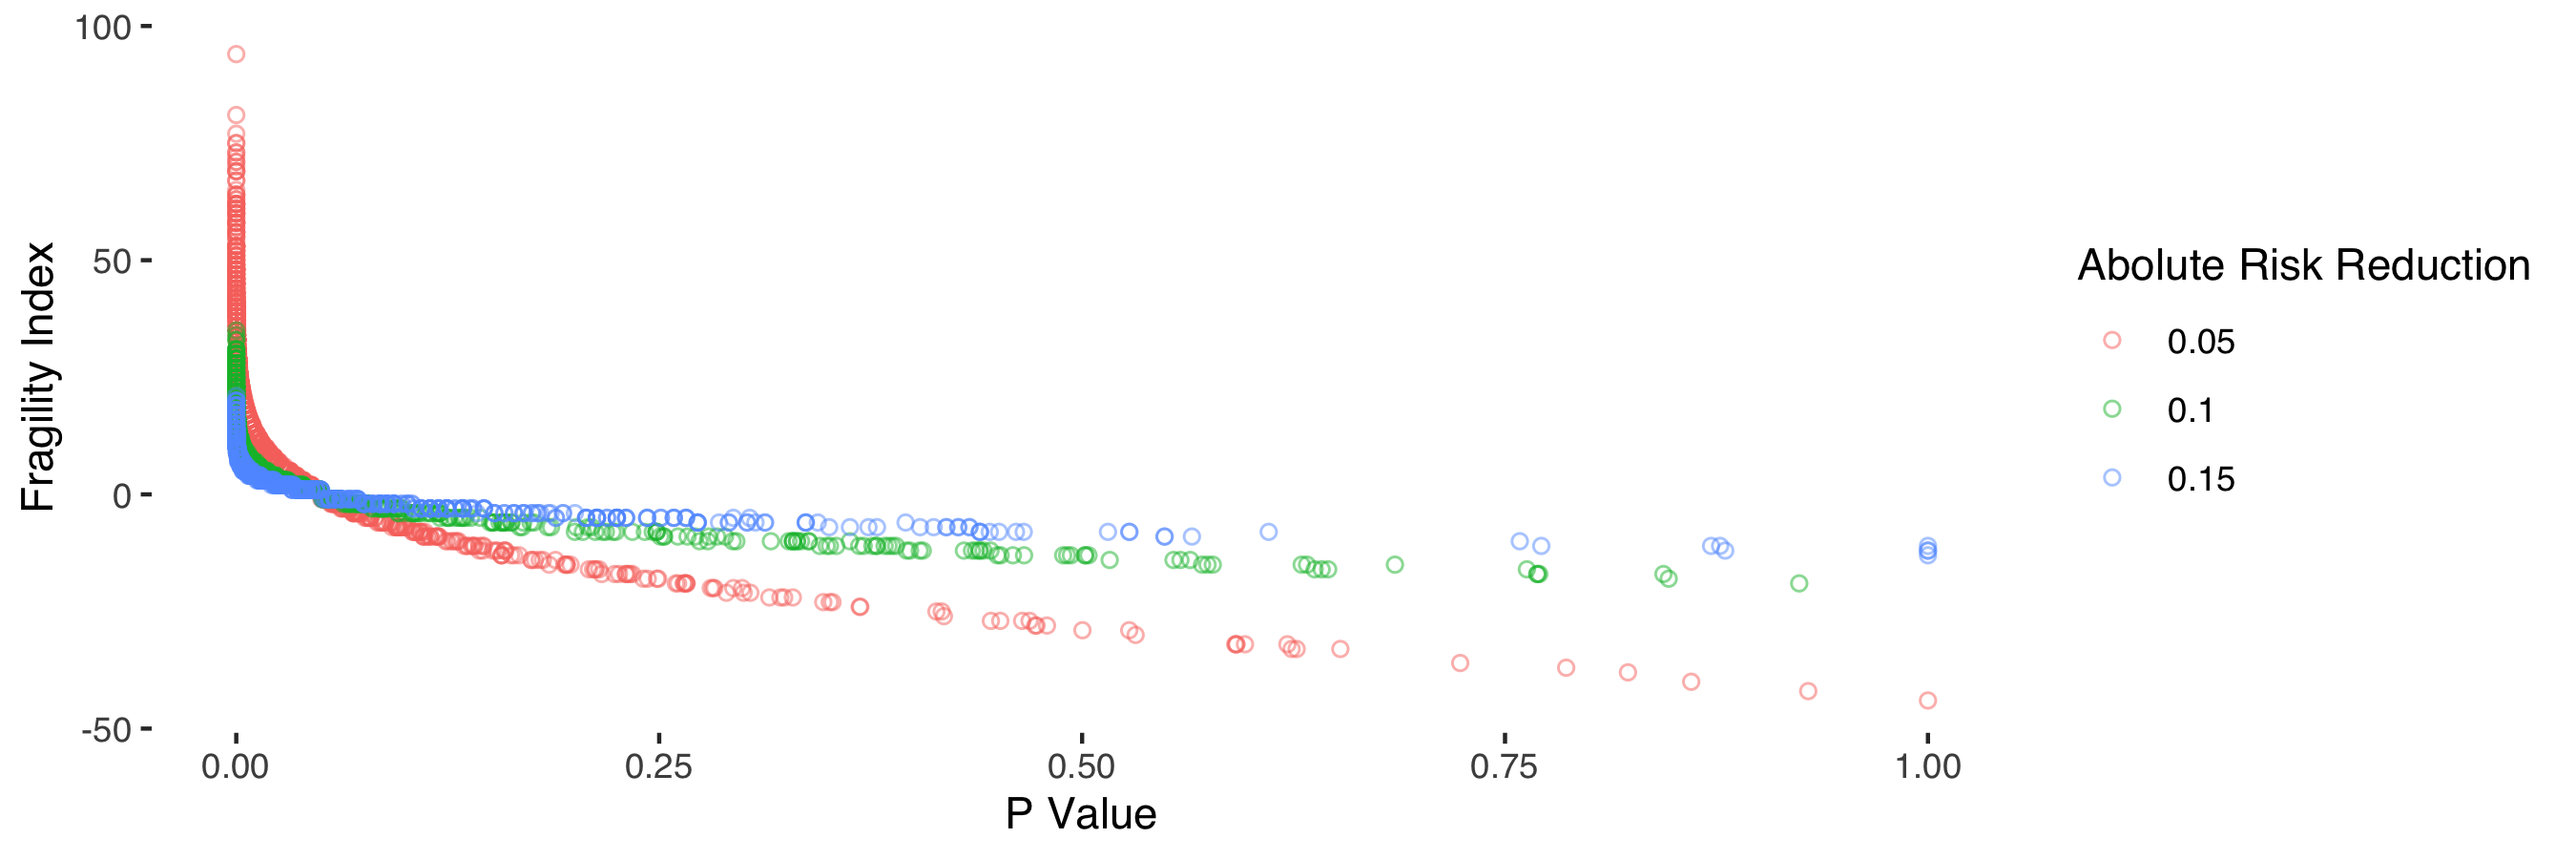
Figure 3: Relationship between p value and fragility index stratified by absolute risk reduction.
I found a near-perfect relationship (R2 = 0.99) between the fragility index and study p value (log transformed), sample size, observed treatment effect and observed control group mortality (figure 4). Elements of this relationship have previously been recognised (16).
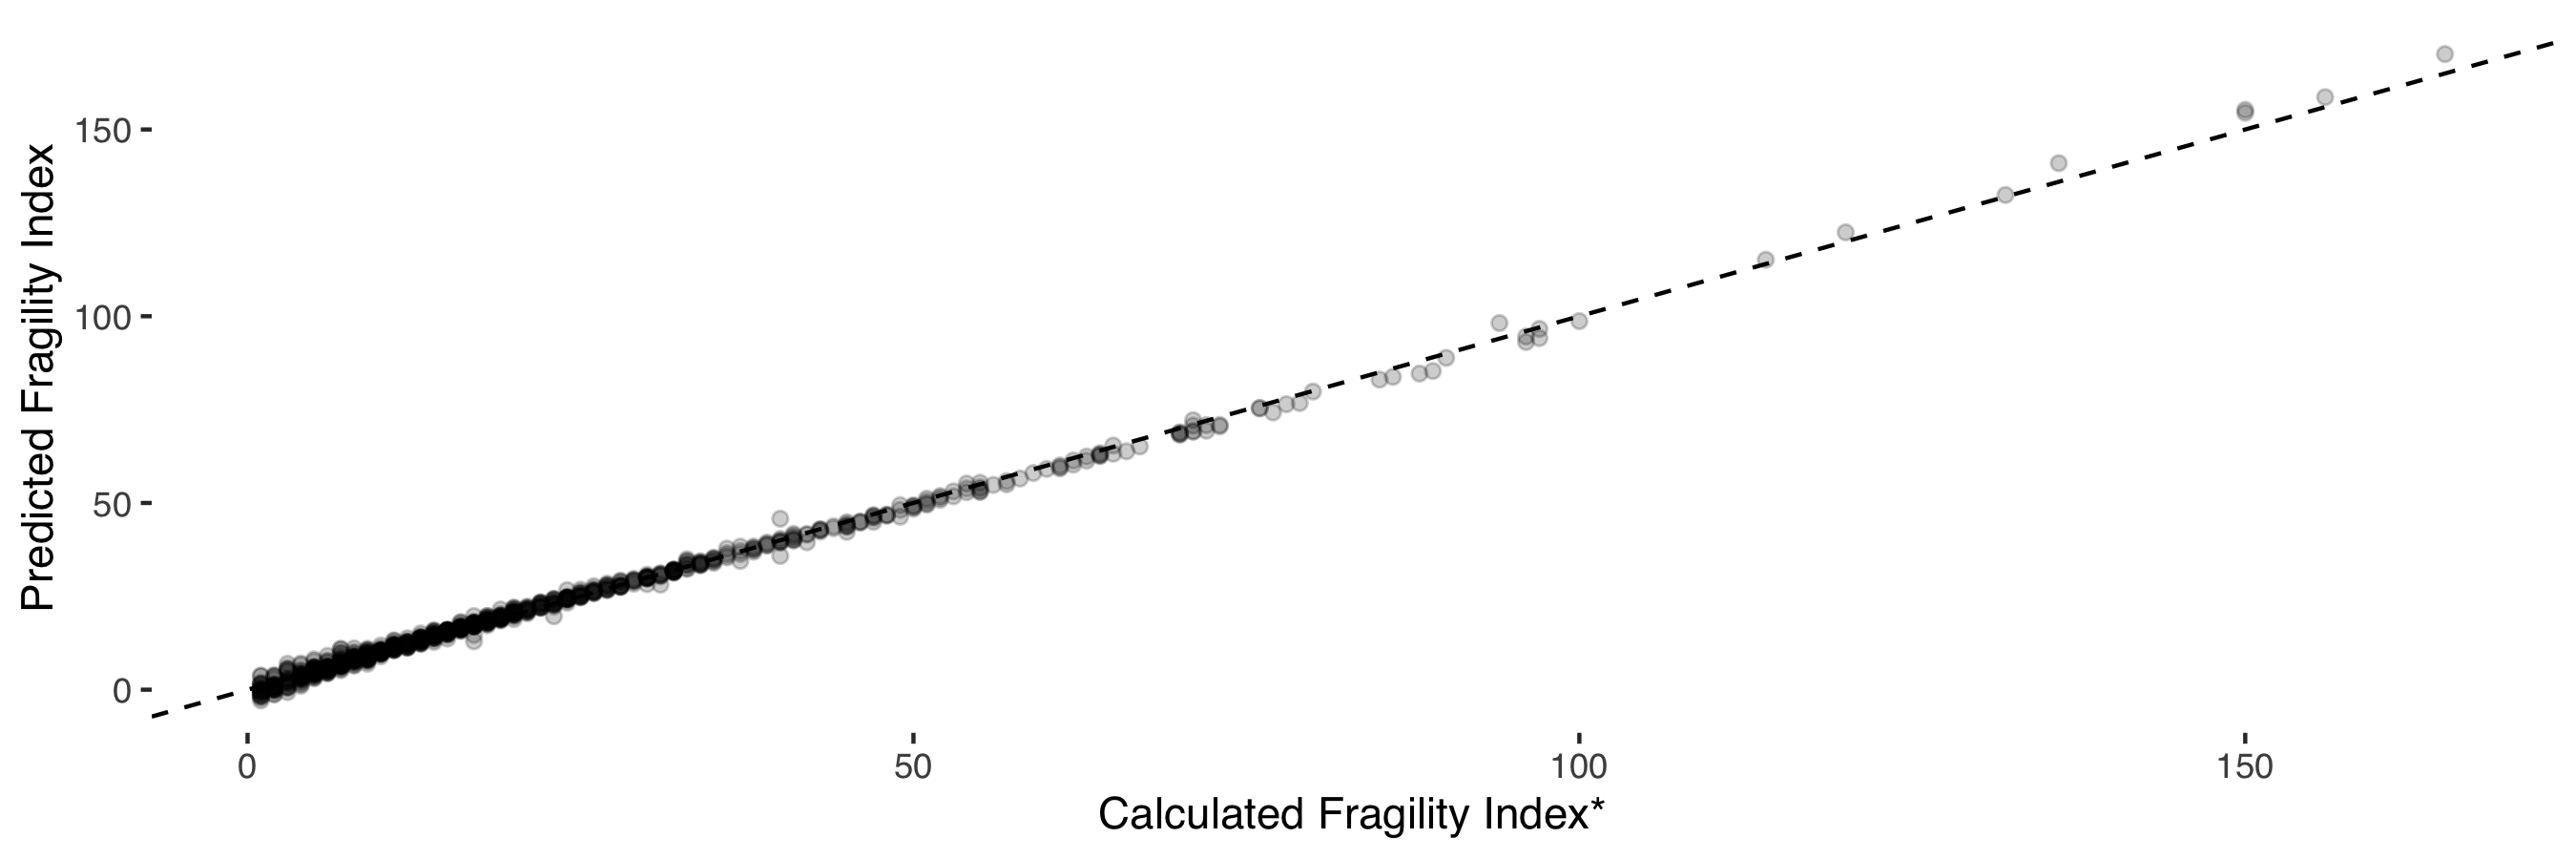
Figure 4: Relationship between predicted fragility index and calculated fragility index. The predicted fragililty is a function of the log transformed p value, number of study participants, observed treatment effect and control group mortality.
Thus, the fragility index is an encapsulation of these study parameters into a single figure. RCTs with identical p values (for example 0.04) will differ in their fragility index only due to the difference in these observed study characteristics.
There has been a long-standing tension between statistical analysis and the need to inform policy. The former aims to describe an observed effect in terms of uncertainty, whereas policy (such as “should I administer an antibiotic”) is necessarily binary, i.e. to act or not. Ultimately, a line must be drawn where evidence is strong enough to prompt action. That strength of evidence is commonly—though completely arbitrarily—set at a p value of 0.05. The fragility index begs us to entertain a secondary decision boundary. At what fragility index is a study now deemed to be no longer fragile? 5, 10, 500? As demonstrated above, this is simply a request for greater power to provide more evidence for the study question. In RCTs, the optimal study size for a given effect size has already been determined a priori. The Neyman-Pearson Lemma (a mathematical proof) demonstrates that any secondary decision boundary is necessarily less optimal than the original (17).
The impact of the fragility index has a lasting negative effect beyond its well-intended use. A well conducted and robust study labelled as “fragile” is now interpreted with unreasonable scepticism. The emotional loading inherent in the term “fragility” does a disservice to clinicians, scientists and patients who opted to participate in research.
In the context of RCTs, where power is set a priori, the fragility index is an unhelpful metric that casts robust findings into disrepute. A growing number of position papers are now proposing the use of the fragility index to be published alongside RCTs (1, 6, 8, 13). This position should be respectfully challenged as a misinterpretation of statistical inference. The fragility index represents a danger as to how good quality RCTs are interpreted. It serves only to add unnecessary scepticism to legitimate results, and potentially undermines the scientific process. Uncertainty in science should be embraced, but the debate should be directed toward where optimal decision boundaries exist, and not to re-imaginings of the p value.
Acknowledgements
Many thanks to Giampiero Marra and Mervyn Singer (who provided valuable feedback to shape the first draft of this editorial), and Steve Harris, David Palmer, Dave Brealey, Clare Black and Ben Post.